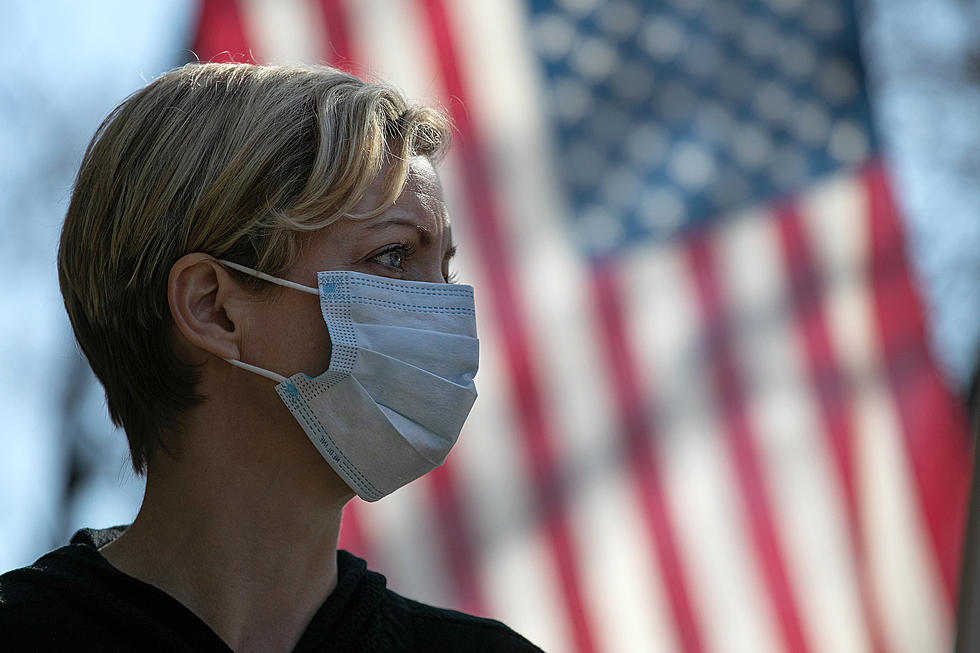
COVID-19 drives NJ’s death rate to highest level in 75 years
TRENTON – While the numbers aren’t finalized yet, New Jersey’s death rate in 2020 was its worst in 75 years, dating back to World War II, as the coronavirus overpowered years of advances in public health.
The first death from COVID-19 in the state occurred one year ago, on March 10, 2020. The most recent figures, as of Tuesday, show 21,238 deaths in New Jersey confirmed as COVID-related over the past 12 months and another 2,397 deaths probably caused by the virus.
Montclair State University epidemiologist Stephanie Silvera, whose brother is a medical historian who studies the 1918 flu pandemic, said the death toll has been incredible.

“We were probably two people who thought it could probably be this bad. I didn’t expect that it would necessarily be going on this long. I was thinking more like six months,” Silvera said.
“I would say the death rate that we’ve seen in New Jersey is higher than I had hoped it would be,” she said. “We had opportunities where we probably could have kept the numbers a little bit lower. It’s a shame that we weren’t able to do that.”
The death rate in the state was 1,076 per 100,000 residents last year, according to the latest data, with 95,545 deaths recorded in a state of an estimated 8.88 million residents. It marked the first year in which more than 1% of the state’s population died since 1953.
Not since 1945, when the rate was 1,160 per 100,000 residents, had the death rate been this high in New Jersey.
The death rate in the state last year was 28% higher than in 2019, as the total number of deaths rose by more than 20,850.
NJ death rate highest in nation
New Jersey’s COVID-related death rate remains highest in the nation. Silvera said that’s in part because the state was one of the first and hardest-hit states.
“That meant we were getting cases before the medical community really had an opportunity to understand how best to treat this virus and how to reduce the risk of death,” Silvera said. “There were still questions early on about how the virus was being spread, what the primary mode of transmission was, and as we played catch-up, our numbers really went out of control fairly quickly. And I don’t know that we’ve ever been able to fully recover from that.”
Silvera said the density of the state’s population and the proximity to multiple international travel hubs that provide an opportunity for the virus to spread from other global locations.
In terms of year-over-year change, the COVID-19 pandemic wasn’t as deadly as the flu pandemic of 1918, which spiked the death rate in the state by 37%. Around 1 in 50 New Jerseyans died in 1918.
But Silvera said that’s a hard comparison to make because the 1918 flu and COVID-19 are different viruses. A century ago, doctors thought influenza was a bacterial infection.
“And our ability to treat is very different. The medical advances are much, much better now, thankfully, than they were a hundred years ago,” Silvera said.
After the 1918 flu pandemic, death rates plunged and never returned to their prior levels. In the five years before that pandemic, death rates averaged 1,442 per 100,000 residents in the state. In the five years after it, rates averaged 1,215 per 100,000.
Silvera said it’s difficult to say that pattern will repeat, in part because many of the people killed by the 1918 flu had tuberculosis, driving down rates of TB deaths starting in 1919.
“What I think may have been happening then and may unfortunately happen again now is that when you have these significant pandemics, the most vulnerable members of the population – in that case it was the very old, very young and very sick, in this case people who are older and have these pre-existing conditions – unfortunately are the ones who are hardest-hit and most likely to die, leaving overall what is generally a healthier population,” Silvera said.
The combined total of 23,635 COVID-related deaths amounts to one out of every 376 residents. It is greater than the population of more than 80% of New Jersey municipalities and most recently surpassed Carteret, Medford and Montgomery as the closest places of comparable size.
The death rates have been highest in Passaic and Essex counties, accounting for 1 of every 293 and 295 residents, respectively.
Case rates in New Jersey remain the highest in the country over the past week, but they are about half their level from two months ago. The number of deaths is down recently and never nearly approached their spring peak in the second wave.
“Our case numbers and our death rates are starting to decline, and hopefully everybody can sort of hang on for a little bit longer so we can get through this pandemic and see what the new normal is going to be,” she said.
Michael Symons is State House bureau chief for New Jersey 101.5. Contact him at michael.symons@townsquaremedia.com.
READ ON: See the States Where People Live the Longest
LOOK: Answers to 30 common COVID-19 vaccine questions
While much is still unknown about the coronavirus and the future, what is known is that the currently available vaccines have gone through all three trial phases and are safe and effective. It will be necessary for as many Americans as possible to be vaccinated in order to finally return to some level of pre-pandemic normalcy, and hopefully these 30 answers provided here will help readers get vaccinated as soon they are able.
More From Lite 96.9 WFPG


